Read the entire syllabus on the course webpage
Complete the following math pre-exam. Please print it out first, and hand in to my office KINSC L302 (slide under the door). This will be graded on effort, not correctness - the purpose of this part of Lab 1 is so that I know how much math review to do later on.
The goal of this lab is to implement a supervised machine learning algorithm (in this case K-nearest neighbors) and apply it to a real dataset. Along the way you should familiarize yourself with some of the terminology we have been discussing in class. You will also get a chance to practice working with large datasets (and practice Python if it has been a while).
This first part of this lab (short numpy introduction) will be done in randomly assigned pairs, but the remainder of the lab should be done individually. You may discuss concepts with fellow classmates, but you may not share or view code.
Your starting files (and submissions) will be handled using git. You should already have a folder for Lab 1:
$ ls /home/<USERNAME>/cs360/lab01/
README.md   knn.py
The recommended editor for this course is Atom, which is installed on the lab machines. You are welcome to use a different editor, as long as we can run your code on the terminal using the commands specified below.
In lab (on Thursday), find your randomly assigned partner. If you are on the waitlist, find a random partner. For this part you should be on one machine. The person whose first name comes first alphabetically should be the “driver” (at the keyboard) and the other person should be the “navigator”. Throughout this short introduction, make sure you both understand everything!
Some steps below are borrowed from numpy quickstart tutorial, which I encourage you to reference throughout the course.
During this course we will often use numpy to manage our datasets. Type the following commands in the python3 interpreter (filling in missing pieces) and make sure the output makes sense:
Array creation and modification
python3
>>> import numpy as np
>>>
>>> # create a 4x5 array of zeros
>>> m = np.zeros([4,5])
>>> m
array([[ 0.,  0.,  0.,  0.,  0.],
       [ 0.,  0.,  0.,  0.,  0.],
       [ 0.,  0.,  0.,  0.,  0.],
       [ 0.,  0.,  0.,  0.,  0.]])
>>>
>>> # create a 3x5 array of zeros using reshape
>>> a = np.arange(15).reshape(3, 5)
>>> a
array([[ 0,  1,  2,  3,  4],
      [ 5,  6,  7,  8,  9],
      [10, 11, 12, 13, 14]])
>>>
>>> # create an array from a list
>>> b = np.array([6, 7, 8])
>>> b
array([6, 7, 8])
TODO and discuss:
.shape attribute to find the shape of m, a, and b abovem using assignment (similar to lists, i.e. m[2][1])reshape m? Try out a few of these to see how the entries behave.reshape do when -1 is used as part of the shape? For multi-dimensional arrays, how many dimensions can be specified with -1.Switch driver and navigator here
Array slicing and concatenation
Try out the slicing operations below, predicting what will be printed each time. Make sure you have modified the m array enough that output is clear.
>>> m[2]
>>> m[:,1]
>>> m[:3,:2]
TODO and discuss:
concatenate function and apply it to your m array and a array to produce an 7x5 array.sort function (from numpy) and apply it to both axes of your m array (as well as axis=None) and make sure the output makes sense.optional: save your interpreter commands to a file and email to each partner
Make sure to always use python3!
Note: you can open knn.py from the command line:
atom knn.pyThe data for Lab 1 is a set of handwritten digits from zip codes written on hand-addressed letters. The datasets is separated into “train” and “test”, and is available here:
/home/smathieson/Public/cs360/zip/zip.test
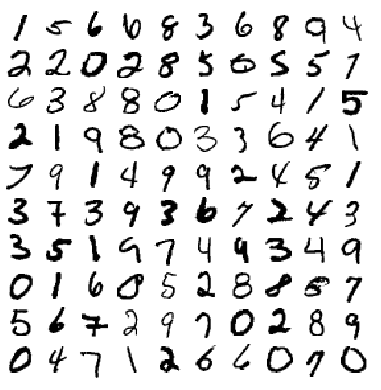
/home/smathieson/Public/cs360/zip/zip.trainRead about this dataset by going to the Elements of Statistical Learning website, ESL, then clicking on the “Data” tab, then clicking on the “Info” for the zip code dataset. It is similar to the MNIST dataset (examples shown below):
Use the command less in the terminal to view the beginning of each file. Both datasets have the same format: the first column is the “label” (here an integer between 0 and 9, inclusive, that corresponds to the identity of a hand-written zip code digit), and the rest of each row is made up of gray-scale values corresponding to the image of this hand-written digit.
One useful technique is to load a dataset from a file into a numpy array. Here is an example:
import numpy as np
train_data = np.loadtxt("path/to/train/file")
In the file knn.py (create this file if you’re on the waitlist), test this approach by printing train_data. Make sure the data format makes sense. You can also import the test data in this way. After you load the data, print the shape. The shape of a numpy array represents the dimensions. What is the shape of the training data? Of the testing data?
print(train_data.shape)
print(test_data.shape)To start, we’ll just consider two classes, but here we have 10. We’ll get to such problems later, but for now, devise a way to retain only the rows which have label 2 or 3. Do this for both the train and test data.
One important note: it may be convenient to relabel the 2’s to -1’s and the 3’s to +1’s, since this will work better with our methods later on (but you don’t have to do this).
The main goal of the lab is to implement the K-nearest neighbors algorithm to predict the class of each example from the test dataset. Exactly how you implement this part is up to you, but your code should be decomposed into functions, well commented, and easy to understand. Here are some suggestions:
Create a function that takes as input (at least) a test example and an integer k, and outputs a prediction based on a nearest-neighbor classifier. This function will loop through all the training examples, find the distance between each one and the input test example, and then find the K nearest neighbors (you are welcome to use numpy sorting methods, but look up how they work first). For this subroutine, we’ll need a distance function.
An important part of many machine learning methods is the concept of “distance” between examples. We often phrase this as a “metric” on our inputs. Create a function that takes as input two examples (any two examples, although in this case we’ll use it with one test and one train), and outputs the distance (we’ll use Euclidean for now) between them. Although there are many built-in functions the perform this task, please implement your distance function from scratch. However, you are welcome to use numpy functions as part of it (for example, you may use np.sum and similar functions, but look up how they work first).
Loop through all the filtered test examples, using your classification function to predict the label for each one. Also create a way of determining if the prediction was correct or not, based on the labels of the test data. Compute the fraction or percentage of correctly predicted examples. How does this change as K varies? Try K 1-10 (at least) and record the accuracy.
When I run your program on the command line as shown below:
python3 knn.pyYou should output something like this (round accuracy to 3 decimal places):
Nearest Neighbors:
K=1, xx.xxx%
K=2, xx.xxx%
...
K=10, xx.xxx%Make sure to fill out the README.md with answers to all the analysis questions! Be sure to commit your work often to prevent lost data. Only your final pushed solution will be graded.
Credit: based on Exercise 2.8 from “The Elements of Statistical Learning”
If you do any of the extensions, document this in your README.md (especially if you included command line arguments). I occasionally demo excellent extensions in class.
Extend your algorithm to a multi-class setting (i.e. distinguish between 3 or more digits). How does this change your best value of K?
If you are familiar with confusion matrices, create one for this test dataset and your “best” value of K.
Create a plot of accuracy vs. K.
Visualize some of the examples that were classified incorrectly. The examples are 16x16 gray-scale images, so you can plot them on a grid.
Create command line arguments for which digits to include (here we chose 2 and 3, but you could let the user decide). Or you could let the user decide how much training data to use, what K value to use, or how many classes to use.
(if you are on the waitlist and can’t see this file)
Name:
userId:
Number of Late Days Using for this lab:
What values of k did you try?
Which value of k produced the highest accuracy? What general trends did you observe as k increased?
When using the entire training dataset, what are your observations about the runtime of K-nearest neighbors? List 1-2 ideas for making this algorithm faster.
(None of your answers below will affect your grade; this is to help refine lab assignments in the future)
Approximately, how many hours did you take to complete this lab? (provide your answer as a single integer on the line below)
How difficult did you find this lab? (1-5, with 5 being very difficult and 1 being very easy)
Describe the biggest challenge you faced on this lab: