The goals of this week’s lab:
Implement a program that uses dynamic programming to compute a pairwise local alignment using a linear gap penalty function. The program should work on protein sequences (you can generalize it to DNA sequences as well, but this is not required).
You should see following starter files in your github repo:
README.md - questionnaire to be completed for your final submissionlocal_align.py - the main program for implementing your sequence alignment algorithmdata/ directory - sample sequences to align including one toy example and 3 gene pairsblosum-62.txt - contains values for the BLOSUM-62 matrix to score substitutionsYou are welcome to add additional python files as for importing into local_align.py.
Your program should take in 5 command-line arguments using the optparse library described in previous labs:
-a-b-m-g (int, usually negative)-oFor example:
python3 local_align.py -a data/test1.fasta -b data/test2.fasta -m blosum-62.txt -g -3 -o test_align.txtMake sure the user is informed if they do not include required arguments. You could also have a default (i.e. -1 or -2) for the gap penalty if the user doesn’t specify it (optional).
The steps below do not have to be done in any specific order (see example outputs for an idea of the end goal), but here is a suggestion of how to proceed. Make sure to test and debug each step, as well as keep in mind good function separation and top down design. There is less structure for this assignment and more freedom in how you want to implement your program.
Reading in the substitution matrix will require some careful thought and testing. There are several options:
numpy array) and then have a separate function that maps amino acid characters to an index. Just in case it’s been a while since you used numpy, here is an example of creating and populating an array:python3
>>> import numpy as np
>>> m = np.zeros([4,5])
>>> m
array([[ 0., 0., 0., 0., 0.],
[ 0., 0., 0., 0., 0.],
[ 0., 0., 0., 0., 0.],
[ 0., 0., 0., 0., 0.]])
>>> m[2][1] = 7
>>> m
array([[ 0., 0., 0., 0., 0.],
[ 0., 0., 0., 0., 0.],
[ 0., 7., 0., 0., 0.],
[ 0., 0., 0., 0., 0.]])
>>> m[:,1] # slice the one-th column of m
array([ 0., 0., 7., 0.])
>>> m[2] # get the two-th row of m
array([ 0., 7., 0., 0., 0.]){'A': {'A': 4, 'R': -1}, 'R': {'A': -1, 'R': 5}}The first pair in the dictionary has a key 'A' and value which itself is a dictionary {'A': 4, 'R': -1}. If I want the substitution value for replacing an 'A' with an 'R', I simple call:
>>> print(m['A']['R'])
-1
where m is the dictionary structure I stored the values in. It’s a bit more complicated to think about, but easier to use since you will not need to map the amino acids to integers.
SubstitutionMatrix such that you can create an object and call a get_score method that does all of the mapping for you.Any of these techniques are acceptable, but your code should be readable and well designed.
For the DP table, there are also several ways to approach the data structure design. You could use a 2D array (list-of-lists), or a numpy array similar to the example above. Make sure to initialize the “base case” (0th row and column) to 0’s. (If you’re already using a numpy array of zeros though, you don’t need to do this part.) Think about the dimensions of this array, and make sure to have x along the rows (left-hand-side), and y along the columns (right-hand-side).
If you are doing the 2D array option (not in numpy), make sure to keep the following issue in mind. The code below will not work for initializing a 2D array!
>>> m = [[0]*5]*4
>>> m
[[0, 0, 0, 0, 0], [0, 0, 0, 0, 0], [0, 0, 0, 0, 0], [0, 0, 0, 0, 0]]
>>> m[2][1] = 7
>>> m
[[0, 7, 0, 0, 0], [0, 7, 0, 0, 0], [0, 7, 0, 0, 0], [0, 7, 0, 0, 0]]For this program, we will obtain local alignments starting from the highest score. This will include multiple instances of the highest score, but NOT all possible tracebacks from each highest score.
To be consistent, and obtain the same output as I have below, break ties using the “high road” protocol where I will go “up” first, then “diagonal”, then “left” (in the event of the maximum being the same for multiple paths). Also make sure to end alignments whenever you see a cell with a zero. To summarize the “high road” protocol:
If there are multiple substrings with the same maximum score, output them all. You can worry about this requirement after you get your program working for just one maximum.
Your data structure for back-tracing will need to work with your dynamic programming table. It is possible to combine these two data structures or leave them separate. Regardless, after building the table and recording where you “came from” for each cell, you’ll need to potentially traceback from several different cells. Think about how to orchestrate these different pieces. Classes may be helpful but are not necesssary.
Note that with dynamic programming we are using a recursive formula to fill in the table, but not actually writing a recursive function.
I have provided several pairs of sample files in your directory:
test1.fasta and test2.fastaInput files will follow a similar format the FASTA format where the first line is a comment describing the sequence, and then each line after that is part of the sequence.
At a minimum, your output should contain:
The maximal alignment score.
The optimal alignments of one subsequence to the other, including gaps. You should break ties within one alignment as listed above. If there is a tie for optimal score at different locations in the score matrix, you should output them all on separate lines.
The sequence identity of the alignment (number of matching characters over the total length of the alignment), as well as the number of gaps (see output below).
The (1-based, inclusive) index of the substrings making up the alignment from the original sequences. That is, the location of the corresponding amino acids (not counting gaps), for each sequence. As an example, the alignment for MSTYG to AXSTXYA results in:
    2 ST-Y 4
      || |
    3 STXY 6
indicating the first sequence, characters 2 to 4 inclusive, align with the second sequence, characters 3 through 6 inclusive. The alignment should be written to the given output file, with no formatting necessary, 1 sequence per line. For example, your file for the above alignment should just have:
ST-Y
STXY
Do not write scores and indices to the file.
Below our the outputs from the provided examples. The standard output of the alignment includes outputting 50 characters per line for each sequence, with the start and ending character indices indicated as well as markers to indicate perfect alignments (‘|’) and substitutions (‘.’). Match this output as closely as you can, but don’t worry if it’s not exactly the same. Below are the outputs for several of the examples:
local_align.pyThe last part of the lab is to run your algorithm on the FOXP2 genes for Species A, Species B, and Species C, which represent Human, Chimp, and Gorilla in some order. FOXP2 is an important gene associated with speech and language, and one amino acid substitution in humans is not shared by any other species. Since right now we have only done pairwise alignment, run your method on all three pairs of these species (with g=-7). Then record your results in the README file and answer a few questions about how to interpret these results biologically.
Make sure to push your code often, only the final version will be submitted. If you create plots, include them as well, but you do not need to push other output files (unless you want to).
Credit: modified from lab by Ameet Soni
There are several ways to extend this assignment. I would recommend both of the options below since they are not too much work and make connections with both past and future material.
Create a option for aligning DNA vs. Protein. For DNA you can use a simplified mutation matrix (i.e. +1 for match, -1 for mismatch). Then apply your method to genomeX_reference.fasta and your output contigs from Lab 2. See how similar your alignment output is to BLAST and if it is faster or slower :)
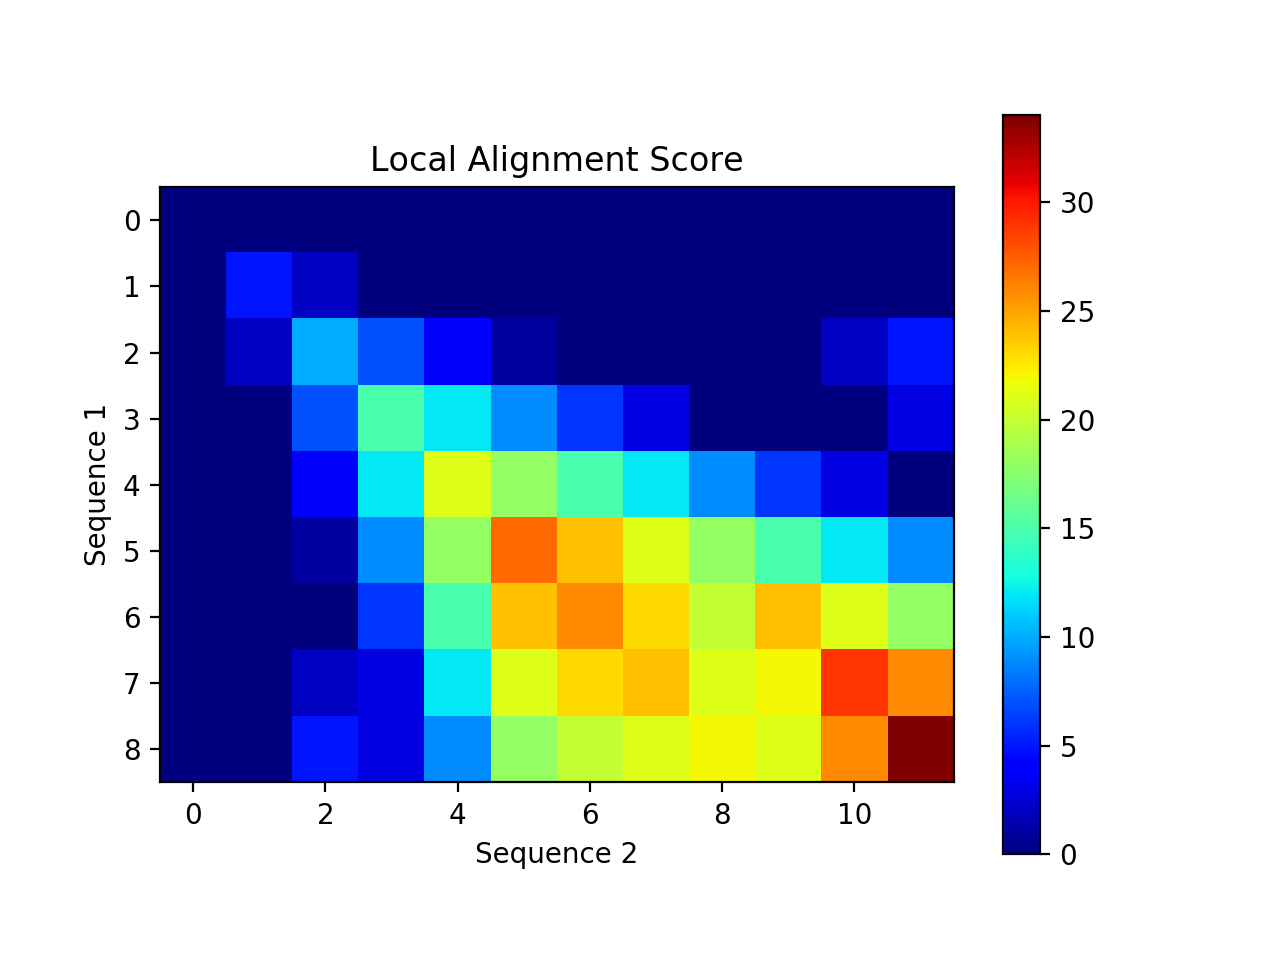
Create a visualization of your alignment. The one below uses a heatmap in matplotlib to show areas of high and low alignment scores. It would also be interesting to create a visualization that looks like the tables we’ve been creating in class (with numbers in each box, arrows, tracing back, etc). One way to do this is to use plt.text(x, y, s) where (x,y) represents the location of the text and s is the string of text. Here is an example of how to create a heatmap:
import matplotlib.pyplot as plt
...
# create dynamic programming table (2D array)
...
heatmap = plt.imshow(my_2D_array, cmap='jet', interpolation='nearest')
plt.colorbar(heatmap)
plt.show()
There are many awesome color schemes to choose from for the cmap parameter. The one above uses “jet”.