This lab has 3 parts, which will be weighted roughly equally. In addition to an implementation, there are also a few problems. The goal of this part is help deep understanding of the material through seeing it in different ways. We will also use real human data from the 1000 genomes project. You are welcome to work on the 3 parts in any order, although the runtime analysis will ultimately require Gusfield's algorithm to be working correctly. In summary, by the end of this lab you should be able to:
Find your partner and clone your lab06 git repo as usual. You should see following starter files:
README.md - questionnaire to be completed for your final submissionperfect_phylogeny.py - where you should implement Gusfield's algorithmruntime.py - where you should devise a way to compare the runtime of Gusfield's algorithm and a naive algorithmdata/ directory - input binary matrix dataYou are welcome to add additional python files as long as the top-level files are the same.
Perfect phylogeny should take in 2 command-line arguments using the optparse library. You are welcome to add a small number of additional arguments, but make sure they are clearly documented (i.e. when I run your program with no arguments a helpful message is produced). For example, you might want to add a command-line argument for the number of sites (or samples) to analyze.
-m-tThe input file has the samples as rows and the sites as columns (see in-class example below). This is actually not typical of genomic data file formats, since there are typically many more sites than samples. But to be consistent with what we've done in class we'll write the matrices this way:
Handout 18, Example 2:
A 0 0 0 0
B 0 1 0 0
C 1 0 0 0
D 1 0 1 1
E 1 0 0 1
You may assume the data is in the right format and only contains 0's and 1's.
The output below is minimal and should be used a guideline. You are welcome to include intermediate output, but make sure it's not overwhelming (test on the larger examples at the end). You should output a tree in pygraphviz format (or another format like networkx is fine).
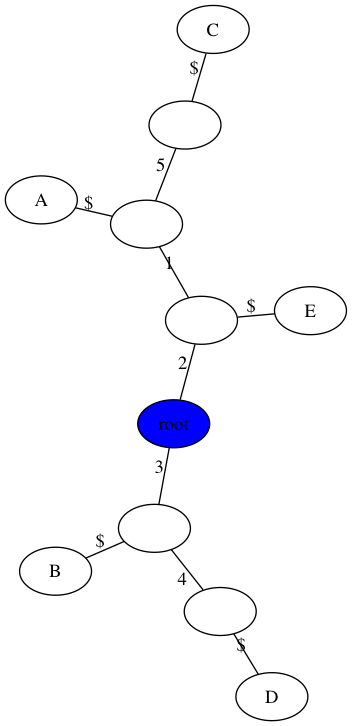
Handout 18: Example 1
$ python3 perfect_phylogeny.py -m data/inclass1.matrix -t figs/inclass1.png
----------------------------
Welcome to Perfect Phylogeny
----------------------------

number of samples, n = 5
number of sites, m = 5

Perfect Phylogney? True
number of repeated mutations: 0
Handout 18: Example 2
$ python3 perfect_phylogeny.py -m data/inclass2.matrix -t figs/inclass2.png
----------------------------
Welcome to Perfect Phylogeny
----------------------------

number of samples, n = 5
number of sites, m = 4

Perfect Phylogney? True
number of repeated mutations: 0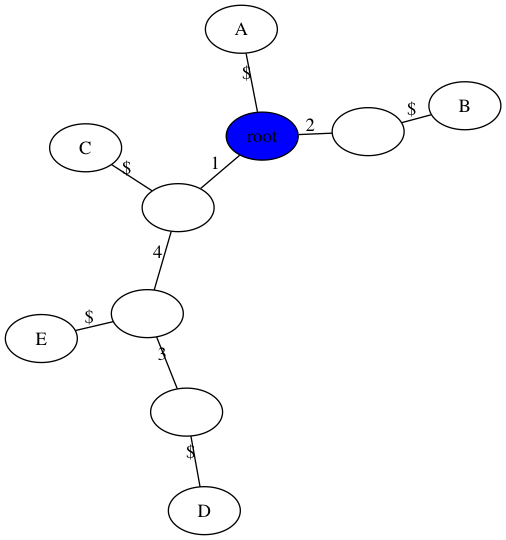
Extra example without a perfect phylogeny
$ python3 perfect_phylogeny.py -m data/extra.matrix -t figs/extra.png
----------------------------
Welcome to Perfect Phylogeny
----------------------------

number of samples, n = 5
number of sites, m = 4

Perfect Phylogney? False
number of repeated mutations: 2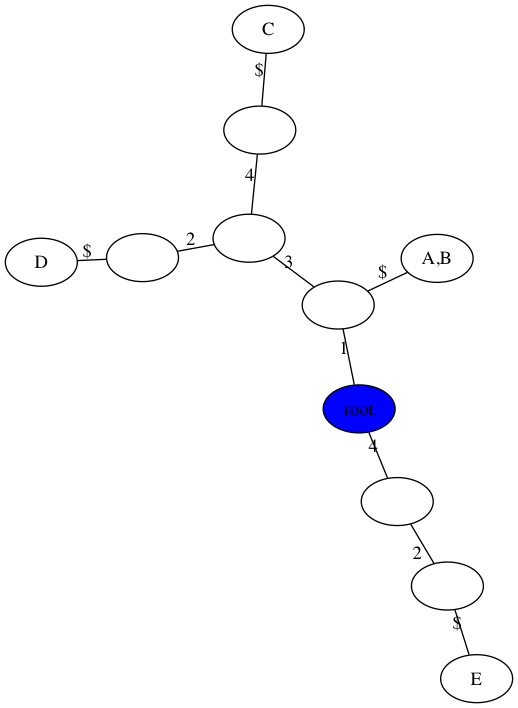
There are three main steps to implementing Gusfield's algorithm:
Radix sort the columns of the matrix. Although we have binary data here, your implementation of radix sort should be general for any alphabet. You should implement radix sort from scratch without using any built-in sorting functions.
Rewrite the rows of the matrix as the list of columns containing a 1.
Create a keyword tree (also called trie) from the rewritten rows. Hint: what type of function would be more natural for this step? In the process of creating this keyword tree, you should also create a visualization which can be written to a file.
After implementing these steps, devise a way to determine if there is a perfect phylogeny or not. You should print this result, along with the number of repeated mutations. I would recommend using a class for your perfect phylogeny algorithm, but it is not required.
Note: your trees do not have to look exactly like this. You are welcome to omit the $ character in the visualization or make the root at the "top" (see extra credit from last week). You can also change the size of internal nodes or collapse non-branching nodes into a single edge. Also, I used 0-based indexing for the sites in implementation, and just added one to the edge labels to make the tree consistent with our in-class work.
You should run your implementation on the three examples above, as well as the two files here:
/home/smathieson/public/cs68/hg_chr20_n1000.matrix (m=5000)
/home/smathieson/public/cs68/sim_n100.matrix (m=1359729)
These are large files so I would recommend running your algorithm on a subset of the sites (i.e. the first x sites).
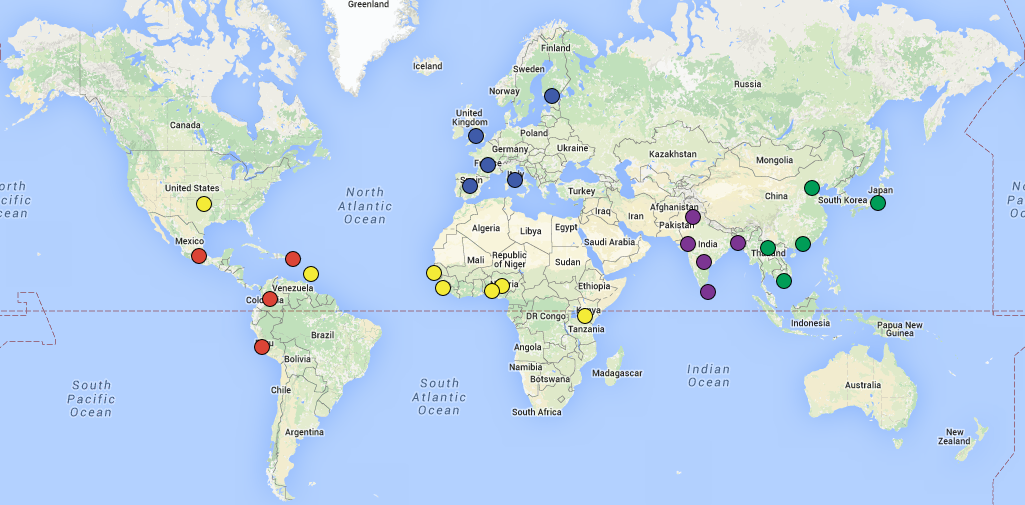
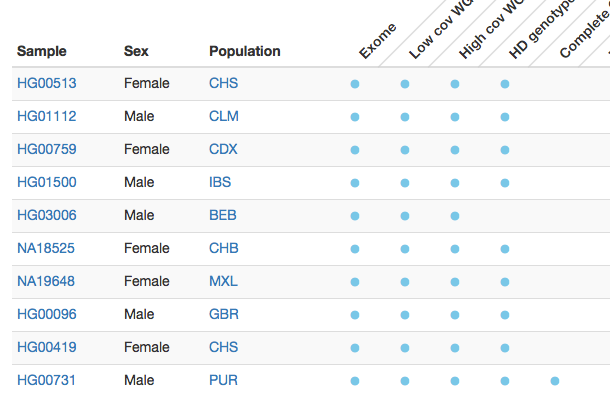
README file asks a few questions about this dataset, and there is an extension related to this dataset at the end of the lab. Here is a map of the 1000 genomes populations and what the data portal looks like (from the 1000 genomes project page):

In terms of what to submit, you do not need to create and push a figure for the simulated data, just the human data.
Complete the following Perfect Phylogeny problems. You can either submit these on paper to the dropbox outside my office (Science Center 260) or put them on git as either a scanned image or use LaTeX.
One way of determining if there is a perfect phylogeny is to look at all pairs of columns i, j and see if Oi and Oj are disjoint or one contains the other. In the runtime.py file, implement this approach, which we will refer to as the "naive algorithm" although it makes use of a non-trivial observation about perfect phylogenies. Then compare the runtime of the naive algorithm to Gusfield's algorithm, in terms of the number of sites.
Use the /home/smathieson/public/cs68/sim_n100.matrix dataset, which represents a "worst-case" runtime scenario for the naive algorithm.
Exclude the tree drawing part from the runtime analysis - the goal is just to get to a yes/no answer about the perfect phylogeny.
You can use the time module as we did before. Your final output should be a matplotlib graph with the number of sites m on the x-axis and the runtime of each algorithm on the y-axis. Make sure to include axis labels, a legend, and a title.
Finally, answer the questions in the README about the runtime analysis (namely, does your plot agree with our problem set answers?)
The extensions this week involve looking more closely at the human dataset. First, download the sample information from the data portal which shows the population that each sample belongs to. Then color-code the leaves of your tree figure based on the population. Try this for different continuous subsets of the sites in this dataset. What observations can you make about the results?
If you do this part, push your final figure, and make a note in the README about any observations.
There is also an optional extension in the problem set (to prove the reverse direction of the perfect phylogeny theorem).
Make sure to push your code often, only the final version will be submitted. The README.md file asks a few questions about human dataset and runtime analysis. Answer these questions and make sure to push the following files. I would recommend making a figs directory for the figures. It is very helpful if you name your figures the same as below - thanks!
README.mdperfect_phylogeny.pyruntime.pyinclass1.png, inclass2.png, extra.pnghg_tree.png (can be on a subset of the sites)runtime.png (runtime figure)