This is two week lab with a checkpoint on March 8 during lab. The goals of this lab:
pygraphviz to visualize the resultsFind your partner and clone your lab05 git repo as usual. You should see following starter files:
README.md - questionnaire to be completed for your final submissionupgma_tree.py - where you should implement the UPGMA algorithmnj_tree.py - where you should implement the NJ algorithmdata/ directory - input dissimilarity mapsYou are welcome to add additional python files as long as the top-level files are the same.
Both tree building programs should take in 2 command-line arguments using the optparse library. You are welcome to add a small number of additional arguments, but make sure they are clearly documented (i.e. when I run your program with no arguments a helpful message is produced). For any additional arguments, add a default (i.e. default=16 for an integer such as the font size).
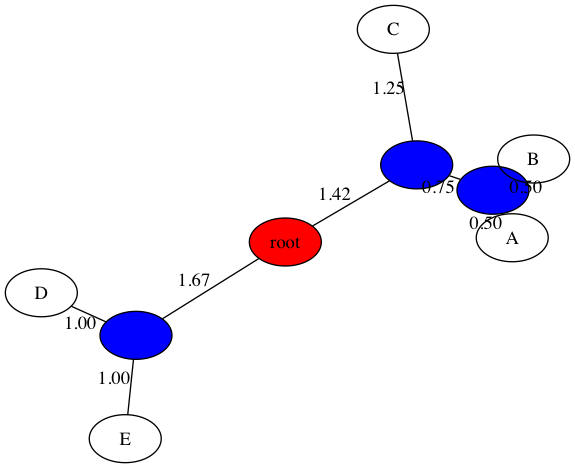
-d-tThe examples below show output from both UPGMA and NJ (on our in-class example). First is UPGMA:
$ python3 upgma_tree.py -d data/delta_inclass.txt -t figs/inclass_upgma.png

Welcome to UPGMA phylogenetic tree builder!

Input dissimilarity map:

    A   B   C   D   E
A   0.00    1.00    3.00    6.00    6.00
B   1.00    0.00    2.00    5.00    5.00
C   3.00    2.00    0.00    5.00    5.00
D   6.00    5.00    5.00    0.00    2.00
E   6.00    5.00    5.00    2.00    0.00

--------------
Iteration 1
--------------
Merging: A B

    C   D   E   A-B
C   0.00    5.00    5.00    2.50
D   5.00    0.00    2.00    5.50
E   5.00    2.00    0.00    5.50
A-B 2.50    5.50    5.50    0.00

--------------
Iteration 2
--------------
Merging: D E

    C   A-B D-E
C   0.00    2.50    5.00
A-B 2.50    0.00    5.50
D-E 5.00    5.50    0.00

--------------
Iteration 3
--------------
Merging: C A-B

    D-E C-A-B
D-E 0.00    5.33
C-A-B   5.33    0.00

--------------
Iteration 4
--------------
Merging: D-E C-A-B

    D-E-C-A-B
D-E-C-A-B   0.00
Here is the output for NJ run on the same dataset from in-class:
$ python3 nj_tree.py -d data/delta_inclass.txt -t figs/inclass_nj.png

Welcome to NJ phylogenetic tree builder!

Input dissimilarity map:

    A   B   C   D   E
A   0.00    1.00    3.00    6.00    6.00
B   1.00    0.00    2.00    5.00    5.00
C   3.00    2.00    0.00    5.00    5.00
D   6.00    5.00    5.00    0.00    2.00
E   6.00    5.00    5.00    2.00    0.00

--------------
Iteration 1
--------------
Merging: D E

    A   B   C   D-E
A   0.00    1.00    3.00    5.00
B   1.00    0.00    2.00    4.00
C   3.00    2.00    0.00    4.00
D-E 5.00    4.00    4.00    0.00

--------------
Iteration 2
--------------
Merging: A B

    C   D-E A-B
C   0.00    4.00    2.00
D-E 4.00    0.00    4.00
A-B 2.00    4.00    0.00

--------------
Iteration 3
--------------
Merging: C D-E

    A-B C-D-E
A-B 0.00    1.00
C-D-E   1.00    0.00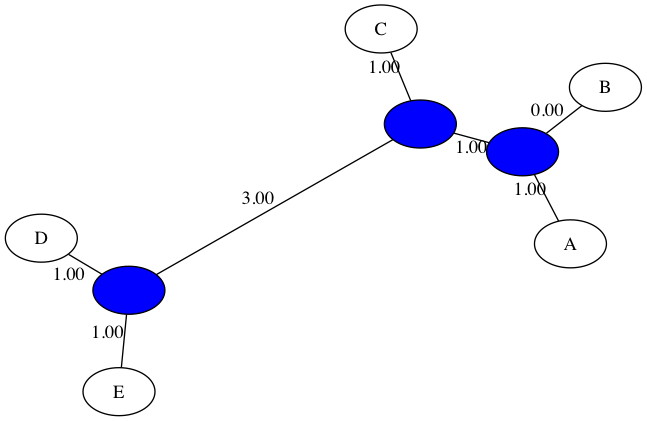
In the following sections I'll discuss the requirements, and give some suggestions regarding implementation.
The first part of the lab is to implement UPGMA. Your UPGMA algorithm should be working by the beginning of lab on March 8. During lab you should demonstrate your working version of UPGMA to me. This will be graded out of 2 points:
To implement UPGMA, we will use pygraphviz to not only store the tree data structure, but to visualize the results. Unfortunately graphviz does not have enough functionality for this problem, so we will have to use a new package, but it is fairly similar. Below I will describe the different parts of your implementation.
The input to UPGMA is a dissimilarity map (delta), which is encoded as a symmetric matrix in the provided input files (similar format to BLOSUM). Create a function for reading in this information and creating an appropriate data structure. I would highly recommend the dictionary of dictionaries approach (see Lab 2), but you are welcome to use another method. It is useful to be able to look up both delta(a,b) and delta(b,a), so I would recommend encoding the entire matrix, not just the upper-triangle.
I would recommend using a class to store the evolving cluster distance matrix Delta and tree data structure. To begin, your tree will only have leaf nodes, no edges. And at first, Delta = delta and each node is in its own cluster (no edges). Below is an example of how to create a tree in pygraphviz:
import pygraphviz as gv
tree = gv.AGraph() # constructs a graph object
tree.add_node("A") # the string is both the label and hash key
tree.add_node("B")
tree.add_edge("A", "B", label="1.0", len=1.0) # set string label as length
tree.draw("my_tree.png",prog="neato") # neato does node/edge layout
The full AGraph documentation is very helpful.
Note that this program does not deal well with edge weights below 1, so you are welcome to set the minimum length to 1 (still have the label reflect the true length though).
Below are a few suggestions about how to implement the iterative step of UPGMA, integrating the pygraphviz tree.
It may be helpful to have a separate Node class that stores information about each node (both leaves and internal vertices). This type of information could include the height of a node, the number of leaves below the node (i.e. cluster size), etc.
During your iterative step, create a new node for the vertex that connects the merged clusters. I would recommend using a name like A-B if you're merging A and B, although you don't need to include this label in the graph visualization (unless you want to). Then figure out the height of this new node and use that to create two new edges of appropriate length.
After modifying your tree, update the cluster distance matrix Delta. If you are using a numpy array for Delta there ARE ways of slicing it (i.e. removing some rows/columns and adding new ones). If you are using a dictionary of dictionaries, you can use the del (delete) operator:
>>> map = {'A': 5, 'B': 10, 'C': 7}
>>> del map['B']
>>> map
{'A': 5, 'C': 7}
When doing UPGMA by hand we usually stop when we get to two clusters, but I would recommend performing one more operation to merge them so you can get the root and corresponding edge weights.
Output requirements: you should have a __str__ method for your class or another type of printing method if you're not using a class. Each iteration, print the updated cluster distances as shown above. Then at the end, output the final tree as a .png file.
The full list of node and edge attributes is very helpful. Here are a few that are particularly useful. Add them as arguments when creating the node or edge (as appropriate).
fontsize=40: it might be useful to make the font size an argument to your programfillcolor="blue": note that to use fill color you also need to change the next attributestyle="filled": changes the style of the node to be filled inlabel="": for larger sample sizes (such as the mammals example), it is helpful to remove the labels of internal nodes. By default the label is the node name.The second part of the lab is to implement Neighbor-Joining. The goal is the same: produce an edge weighted tree and corresponding visualization. Much of the structure of your code should be the same as UPGMA, but the way we merge nodes and the way we update edge weights is different. A few recommendations:
Instead of creating a center node explicitly, I would recommend beginning in the same way as UPGMA, with a node for each sample and no edges. This avoids the issue of having to delete center edges.
The downside of not having a center node is that after the last iteration we still need to connect the final two pieces of our tree. Think about how to best accomplish this last step.
We don't need to keep track of cluster sizes or node height, so an additional Node class may not be as helpful for NJ.
In the data directory there are 3 different dissimilarity maps:
delta_inclass.txt: our original in-class example
delta_primate.txt: a dissimilarity map (from mitochondrial DNA) for primates where:
delta_mammal.txt: a dissimilarity map on a variety of mammals
For each of these datasets, run both UPGMA and NJ (see submission guidelines below for image output). Then answer the questions about these trees in the README.md.
Devise a way of drawing the UPGMA tree like we have seen it in class (i.e. with the root at the top of the figure and all the leaves at the same level on the bottom). This will require working with pygraphviz a bit to position the nodes, or you could investigate a different library such as networkx.
Given an edge-weighted tree produced by either UPGMA or NJ (or any method for that matter), there is an induced tree metric on the leaves. Compute this for either UPGMA or NJ (or ideally both) and then compare the induced metrics to the originals. Note that especially for NJ, this will require actually finding the path between leaves A and B using some form of search (your choice). For UPGMA we could work around this a bit by finding the height where A and B share a cluster, since we could keep track of parent/child relationships. In NJ we don't know the direction of evolution so we don't always know this information. In your README.md file, write up how you did this part and what your conclusions are. Try to make your comparisons quantitative (i.e. compute the sum of squared differences between each entry in the original and induced maps).
Make sure to push your code often, only the final version will be submitted. The README.md file asks a few questions about the trees produced by UPGMA vs. NJ. Answer these questions and make sure to push the following files. I would recommend making a figs directory for all 6 figures. It is very helpful if you name your figures the same as below - thanks!
README.mdupgma_tree.pynj_tree.pyinclass_upgma.png and inclass_nj.pngprimates_upgma.png and primates_nj.pngmammals_upgma.png and mammals_nj.pngCredit: modified from lab by Ameet Soni; mammal data from Joe Felsenstein