CSC 111: Intro to Computer Science through Programming
Lab 6
Due: Friday, Mar. 24 at 11:59pm on Moodle
For this lab, first find your randomly assigned partner. Introduce yourselves - the person with the first name that comes first alphabetically should begin as the "driver", with the other partner as the "navigator". The driver will have the code open, and the navigator will have these instructions open.
At the end of the lab, email the code (finished or not) and transcript to the person who started as the navigator. If you do not finish during lab you have two options:
(1) Arrange to meet before Friday and finish the lab together.
(2) Continue the code separately and denote the part you did on your own with a comment.
Note: it is not an option for one person to complete the code on their own and then send the finished code to their partner to submit. Any code that you submit should be either written by you, or written by you and your partner while you were pair programming. Both partners should submit their code on Moodle.
Part A: Spot Paintings
In this part of the lab you will be creating spot paintings like those of artist Damien Hirst. An example of his work is shown below:
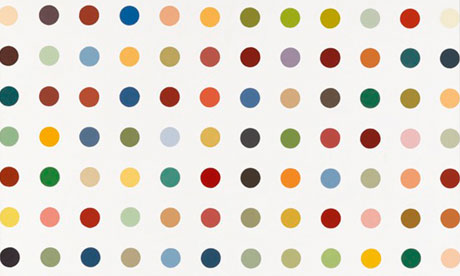
These paintings are said to evoke different moods and reactions depending on the pattern of the chosen colors. In this lab you'll get a chance to choose your own color scheme.
First create a new file called lab6A.py and make sure it is in the same folder as graphics.py. You are welcome to start from the starter code in graphics.py as we have done in class. The next steps will walk you through the process of creating a spot painting.
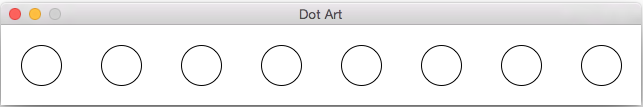
- Using an inside out design, first create a for loop that will create a row of dots along the top of the window. Define variables for:
- the number of circles (at first you can hard-code it to 8 as shown below)
- the radius of each circle (here I used 20, but feel free to change it)
After you have defined these two variables, use them to define the width and height of the window such that the spacing between circles is equal to the diameter of each circle. The spacing at the edges of the window does not need to be anything in particular, but here it is equal to the radius. At the end of this step you should be able to get something like this:
Switch Driver and Navigator here!
- the number of circles (at first you can hard-code it to 8 as shown below)
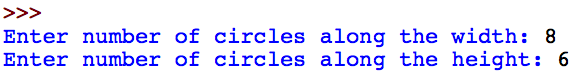
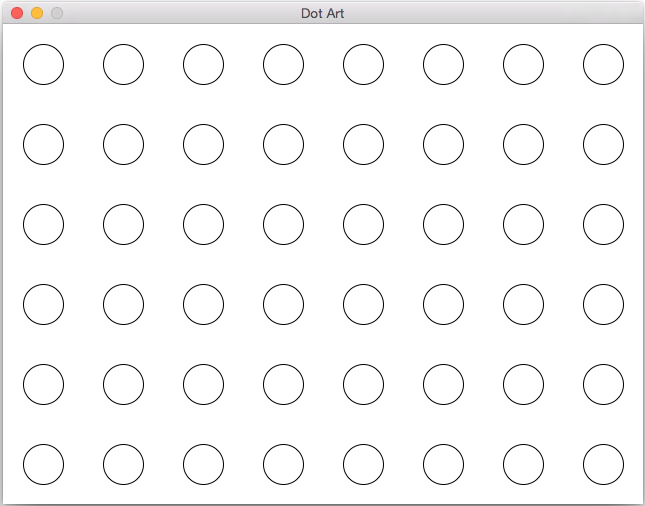
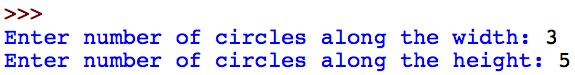
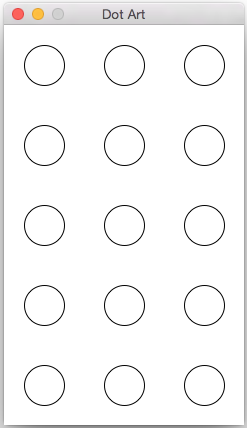
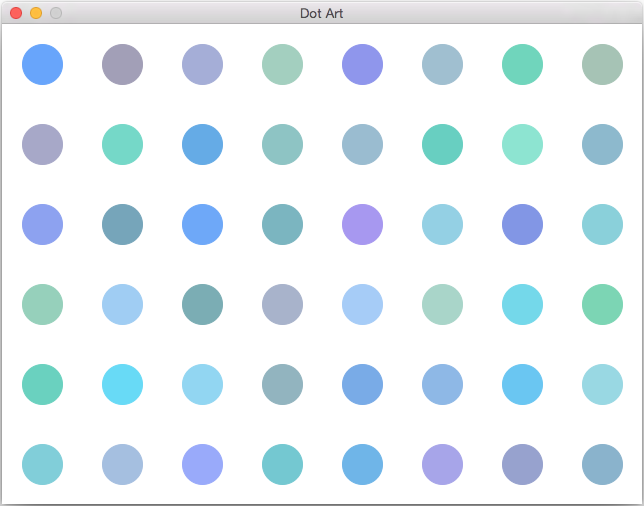
- After this step, create a nested for loop so that with this double for loop, you can create a grid of circles. Define a separate variable for the number of circles in each column. Then make both the number of circles along the width (i.e. num_cols) and the number of circles along the height (i.e. num_rows) into user-specified parameters. So in the shell, you should be able to input the following values and get the following picture:
Here is another example:
Switch Driver and Navigator here!
- Now we are ready to color the dots. For this part, create a new function above main called random_color() that will not take any arguments, but will generate and return a random color. We will use the graphics function color_rgb(r,g,b), which takes 3 integers as parameters: the red, green, and blue components of the color. These components can be 0-255, inclusive. Using the random module, choose values for each component, then return the resulting color.
Here is a converter that can help you develop intuition about how modifying the RGB components will affect the color: Color to RGB. After you've completed this function, call it inside your for loop to determine the color for each dot. Change both the fill color and the outline color to the randomly generated color. Below are a few examples with different color palettes:
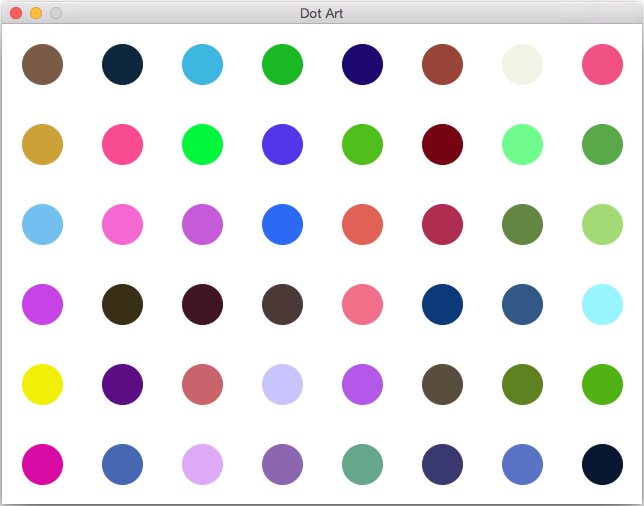
Completely random colors:
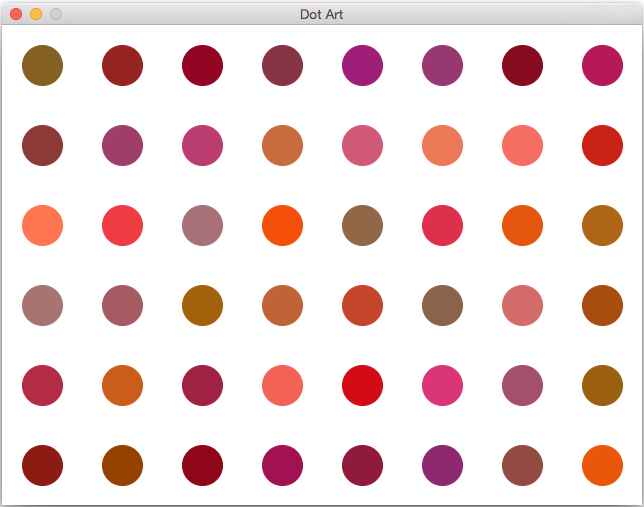
Red color palette:
Blue/green color palette:
- Experiment with the random components to create a color palette you like. Once you have a spot painting you are happy with, take a screenshot and save it as spot_painting.png.
Part B: Line Drawings
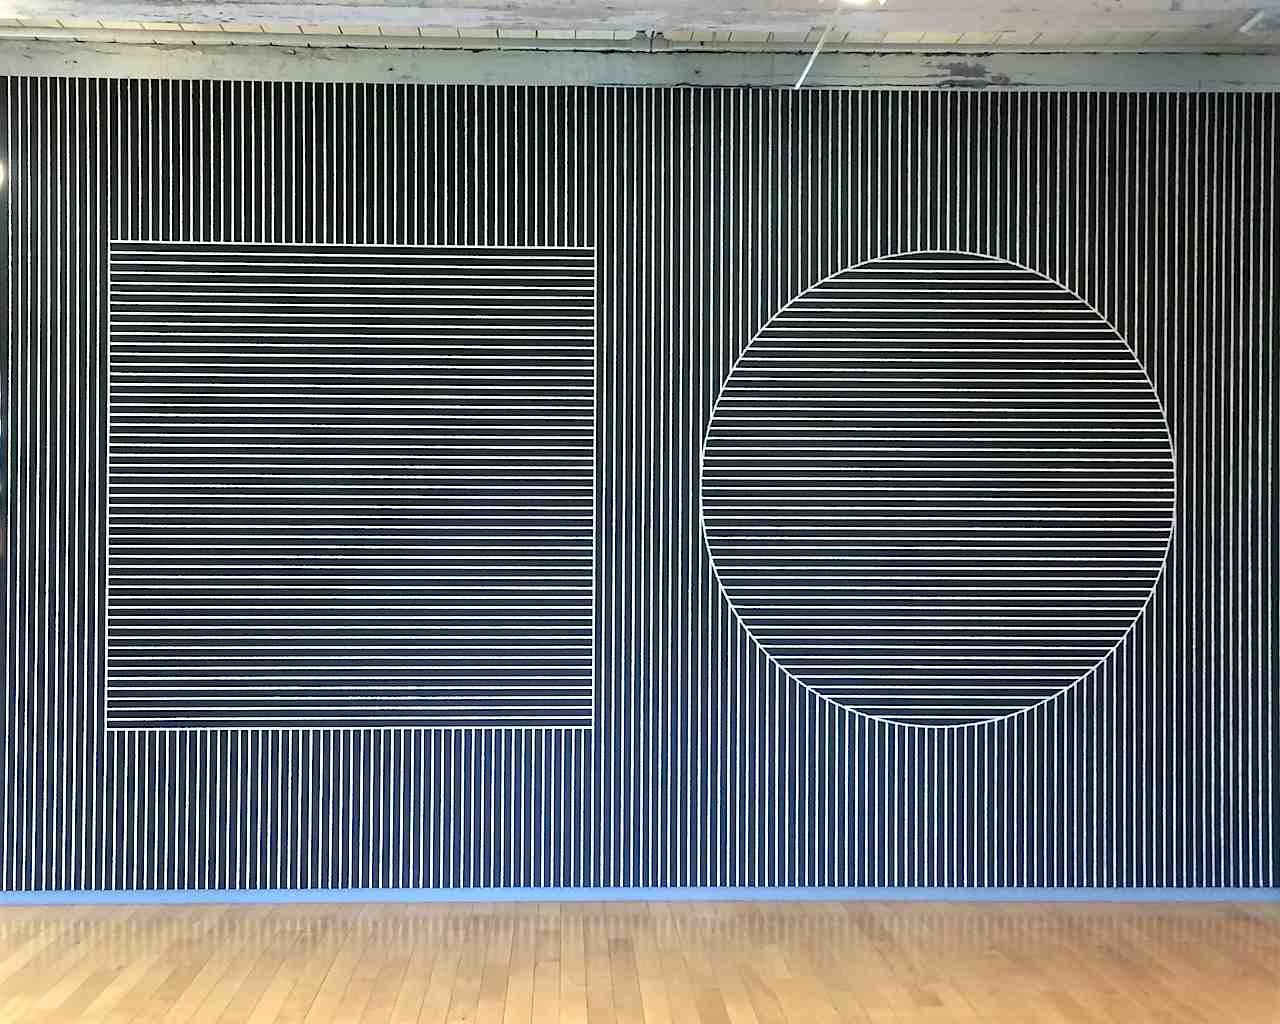
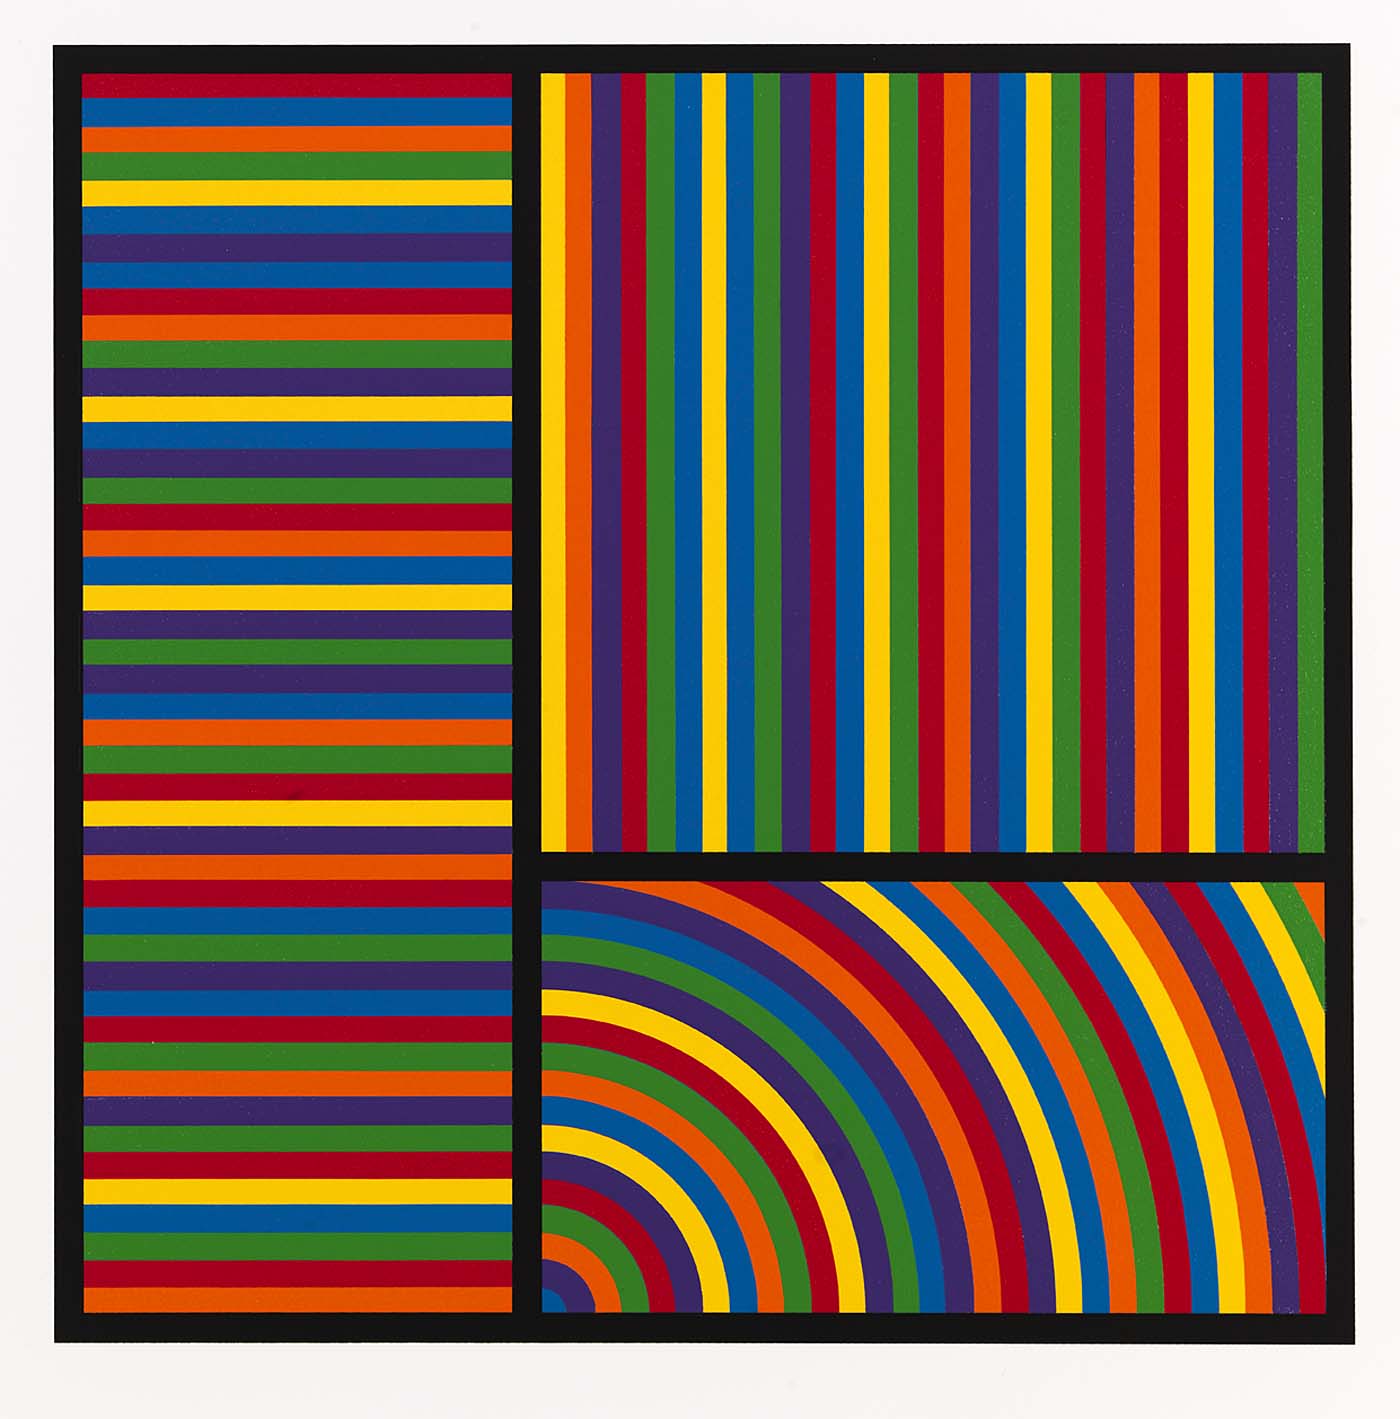
Create a new file called lab6B.py, and you may start in the same way as Part A. In this section of the lab we'll again reproduce an artistic work, this time by Sol LeWitt, whose work is currently displayed at MASS MoCA. Here we will reproduce the left-hand side of the following work:
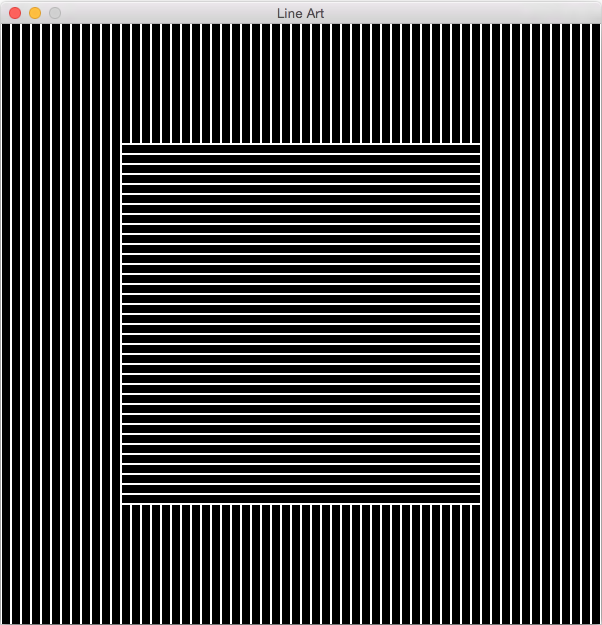
- In Part B we will use a square window, and at first you can hard-code the size (here I used 400). Set up a variable for the separation between each line (here I used 10). Whatever you used for this value, you can use throughout Part B. Based on the window size and the separation between each line, think about how many lines should be drawn. Set up a for loop to create a series of vertical lines as shown below:
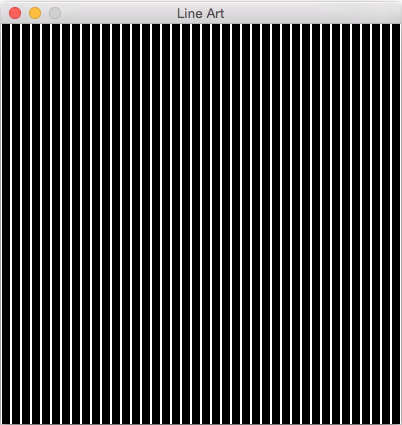
I used a line width of 2, but feel free to modify this, or change the color of the background or the lines.
Switch Driver and Navigator here!
- Next, create a square in the middle of the drawing (the relative size of the square is up to you):
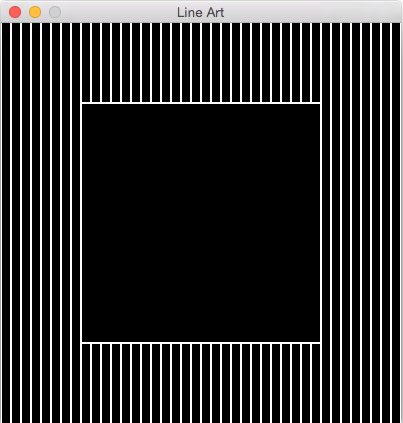
- Create a series of horizontal lines across the square using another loop:
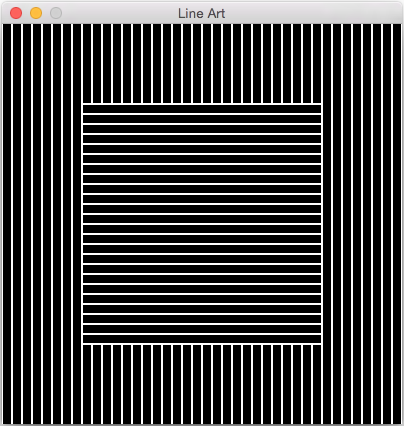
Switch Driver and Navigator here!
- Finally, allow the user to determine the size of the window, and make your code flexible enough to resize the drawing to accommodate the new size. Here are a few examples:
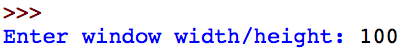
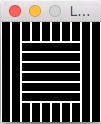
Here the line separation is constant, but the number of lines changes depending on the window size.
Extras
In addition to the square from Part B, also complete the circle on the right to reproduce the entire drawing shown above. Another option:
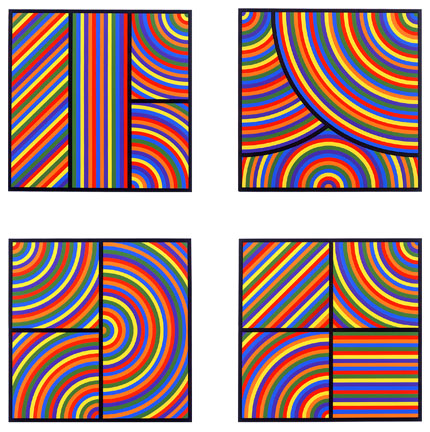
Here are a few other Sol LeWitt paintings to reproduce / modify if you are interested. Feel free to use these as inspiration to create your own geometric painting. If you complete either of these extensions, email me your work and I will show it in class.
Submit
You do not have to submit a transcript for this lab. Make sure that both you and your partner have a copy of all the code written during the lab period, and the screenshots. Both partners should submit the files:
- lab6A.py
- lab6B.py
- spot_painting.png
- line_drawing.png