CSC 111: Intro to Computer Science through Programming
Homework 2
Due: Tuesday, Feb. 14 at 11:59pm on Moodle
Credit: modified from materials by Joe O'Rourke
Quiz 2
UPDATE: please take the short (4 question) Week 2 quiz on Moodle (also due by Tuesday night). This is to help me understand what areas need work, and also help you understand what concepts might need extra practice. It is not a large part of the overall homework grade. Just for the quiz part, do not discuss the questions with other students, TAs, etc.
Overview
The sea level has been rising in recent years (more information in this Wikipedia article), at a rate of around 2-3mm per year. There is also evidence that this rate has been increasing (i.e. accelerating) in some areas.Your task in this assignment is to write one program that requests three numbers from the user: the rate, the acceleration, and the number of years to simulate. Your program then prints out two distinct but related outputs. First, a table showing the expected ocean level over that period of years. Second, a "vertical" graph of that ocean level. Here is a sample output:
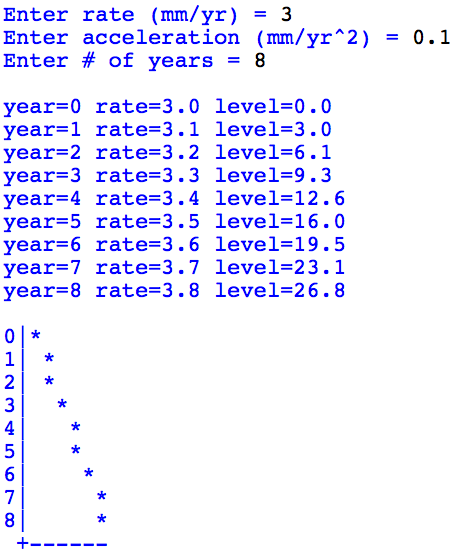
The following steps will help you produce this output, and create a flexible program that can accommodate any numerical user inputs. For this program, you do not need to save all your shell commands and debugging, so it's fine if you close and reopen IDLE several times without saving the output. At the end, run your module at least 3 times with different inputs to show that your program is working. Then just save these 3+ tests.
Step by step
- First, create a new Python file called hw2.py. Set up a main() and write some code to get the user's 3 inputs (similar to what we have done before). Run your program to make sure this part is working.
- Next we will start printing the table of values (ignoring the graph for now). Notice that the user requested 8 years, but 9 lines of the table are printed. This is so that we can print out year 0. At year 0, the ocean level is 0.0, and the rate is whatever the user entered (as a decimal), so 3.0 in this example.
It is only by year 1, when a year has passed, that the ocean level increases from 0.0 to 3.0. So "year 1" means "after 1 year." Set up a for loop for this part, and make sure you can print the years correctly (first column of the table). Notice the lack of spaces around the equals sign.
- To tackle the changing rate and changing sea level, think about how to create variables for these values. After year 1, the annual rate of rise has increased by the acceleration 0.1, so the new rate is 3.1 at the end of year 1, for use from year 1 to year 2. When this is added to the old year-1 level of 3.0, the new year-2 level is 6.1. This repeats until the last year the user entered. Throughout, we assume the acceleration is fixed: It is the same year after year. But the rate of rise keeps increasing. Round the rate the rate and level to one decimal place in the printout (but not the variables holding the level and rate, otherwise your computations will be increasing inaccurate! Example: rate of 0.03)
- After printing out the table, print the ocean level as a graph. Set up a second for loop, and first just try to print out the year and a vertical bar. After that is working, you will need to redo some of the computations from the first loop so that you will be able to plot the values.
- To plot the sea level, print out the space character (" ") several times. The number of spaces should be equal to the ocean level divided by 5, rounded to the nearest integer. In other words, one space for every 5mm. So when level is 0.0, level/5 is 0, so no spaces are printed for year 0, and you see '0|*': the bar and star are adjacent. In the above example, in year 6, level is 19.5, and round( 19.5 / 5 ) is 4, so you see '6| *' on that line, with 4 spaces between the bar and the star.
- To complete the graph, draw the "other axis" with the symbols '+--------', long enough to match the last star.
More Examples
Here are two more examples, and a one more thing to notice:
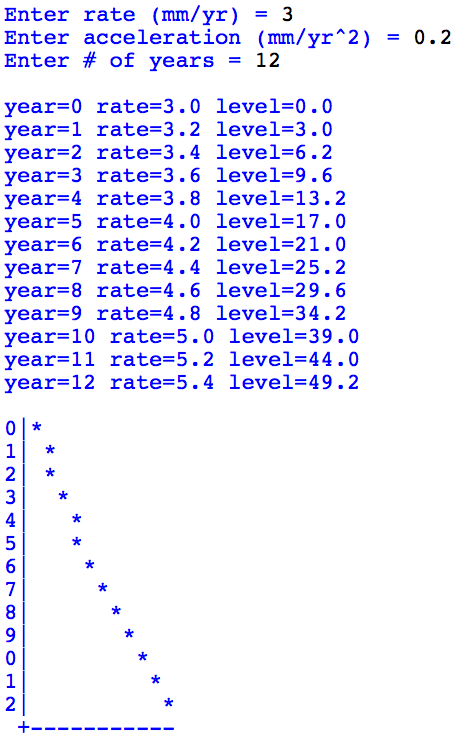
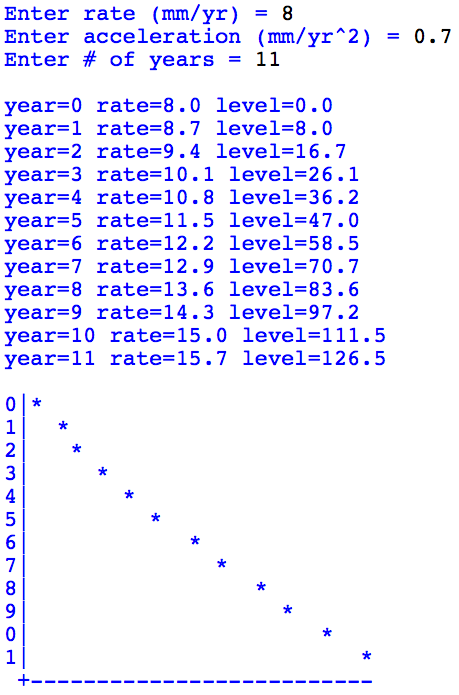
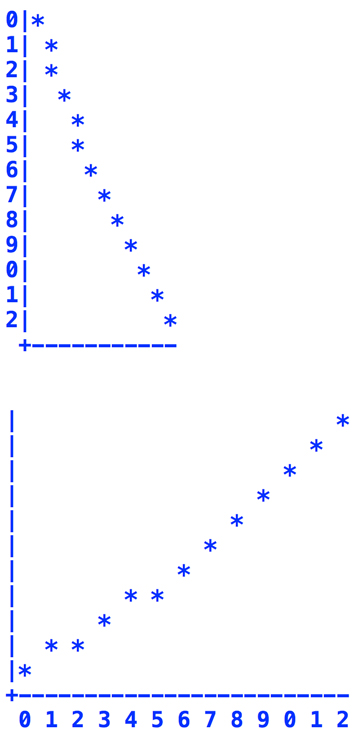
Here note that when the year becomes two digits (10, 11, 12), just a single digit is displayed at the left. You should be able to accomplish this using the % operator as discussed in class. One more example is shown below:
Challenge
The following challenge is not for a grade or extra credit, but to provide further practice and extensions of this material. If you attempt this challenge, provide a comment at the top of your code, and produce both types of graphs shown below.The challenge is to produce a horizontal graph (what we are typically used to seeing for a problem like this). Here are a few examples of what the output should look like:
Example 1:
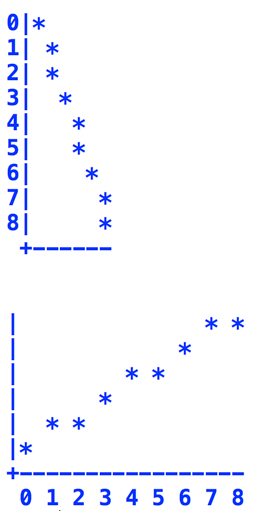
Example 2:
Transcript and Submit
Finally, create a transcript that demonstrates your code working on at least 3 different sets of user input. Save this file as hw2_transcript.txt.
TO SUBMIT ON MOODLE:
- hw2.py
- hw2_transcript.txt